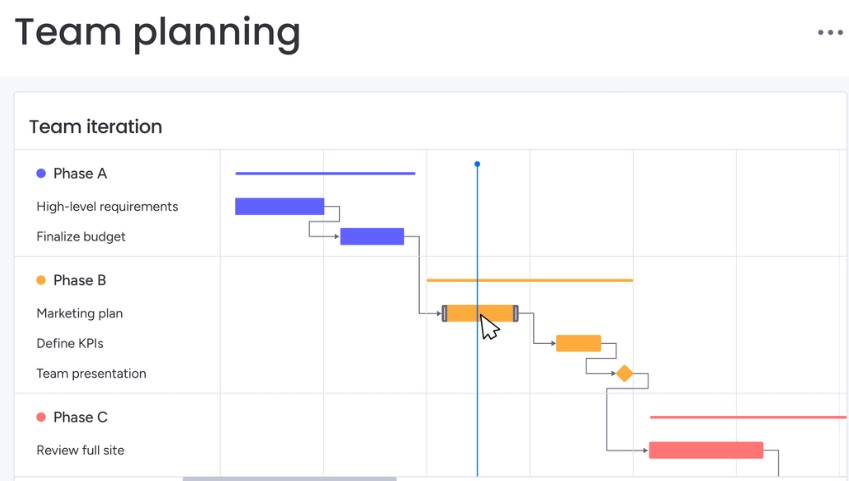
As a project manager, using the Gantt Chart View in monday.com can help you simplify complex projects and enhance your workflow in the following ways:
Visual Project Planning: The Gantt Chart View provides a clear, visual representation of your project timeline, tasks, and dependencies. This makes it easier to understand the overall project structure, identify potential bottlenecks, and plan project activities more effectively.
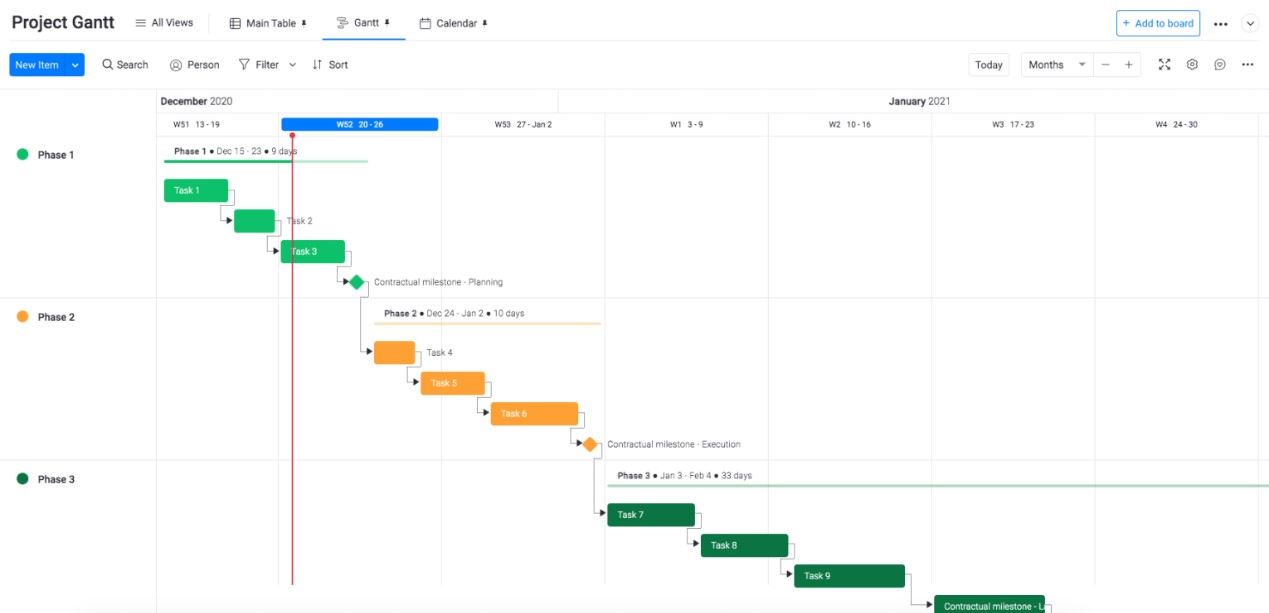
Task Scheduling and Dependencies: The Gantt Chart View allows you to easily schedule tasks and set dependencies between them. You can drag and drop tasks, adjust start and end dates, and see how changes in one task affect the overall project timeline.
Resource Management: The Gantt Chart View helps you manage project resources more efficiently. You can assign team members to specific tasks, track their workloads, and identify potential resource conflicts or over allocation.
Progress Tracking: The Gantt Chart View provides a visual progress indicator for each task, allowing you to quickly see which tasks are on track, behind schedule, or completed. This helps you monitor project progress and make informed decisions about task prioritization and resource allocation.
Customizable Views: monday.com’s Gantt Chart View is highly customizable, allowing you to adjust the level of detail, color-coding, and other visual cues to suit your project management needs. You can also save custom views and share them with your team.
Dynamic Updates: The Gantt Chart View in monday.com is integrated with the platform’s other features, such as the board view and calendar view. This means that any changes made to tasks, deadlines, or assignments in other views are automatically reflected in the Gantt Chart, keeping your project information up-to-date and synchronized.
Collaboration and Communication: monday.com’s Gantt Chart View facilitates collaboration by allowing team members to leave comments, assign tasks, and receive notifications directly within the chart. This helps improve communication and streamline project management workflows.
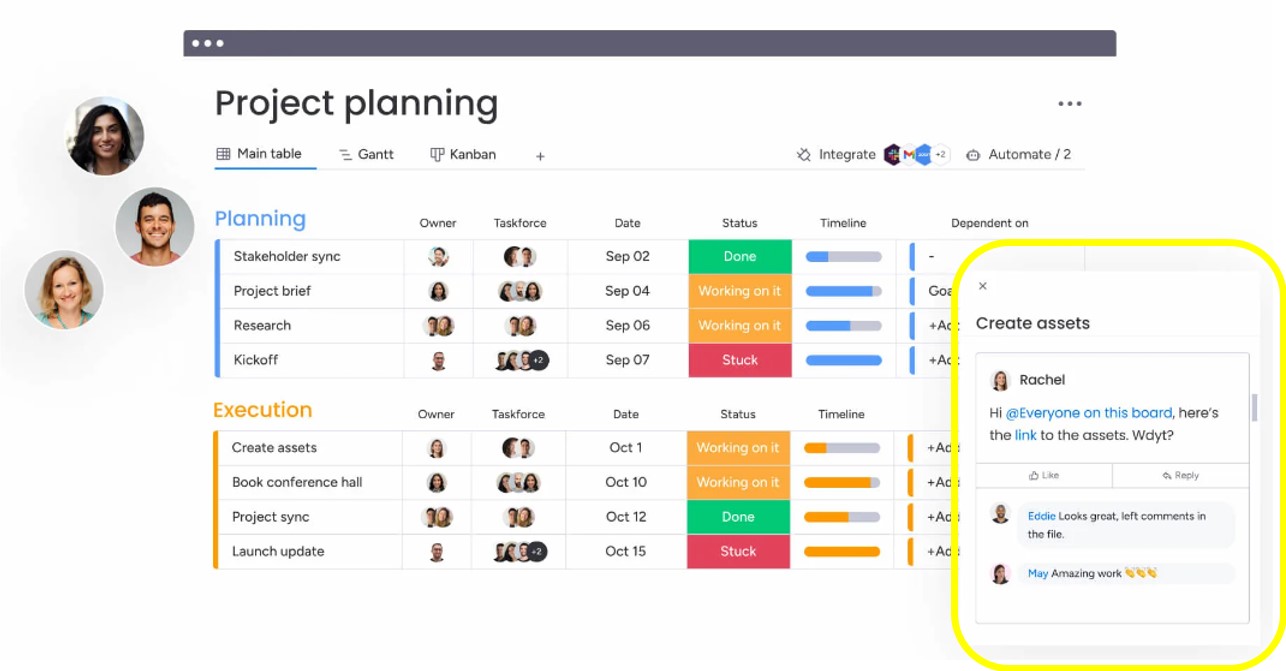
What is a Gantt chart?
A Gantt chart is one of the most classic and useful ways of showing activities displayed against time! A Gantt chart is a horizontal bar chart that shows a project’s planned schedule and its tasks or events between a start and finish date. Each bar in the Gantt chart represents a task, while the dates are laid out horizontally.
To add the Gantt widget to a Dashboard or Dashboard View, select “Gantt” from the widget options:
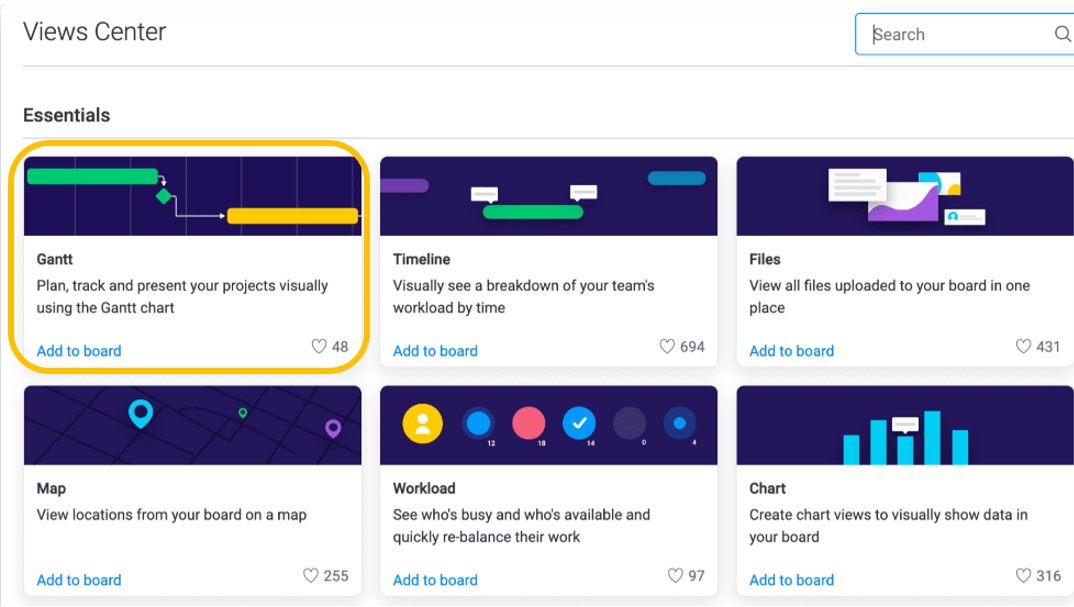
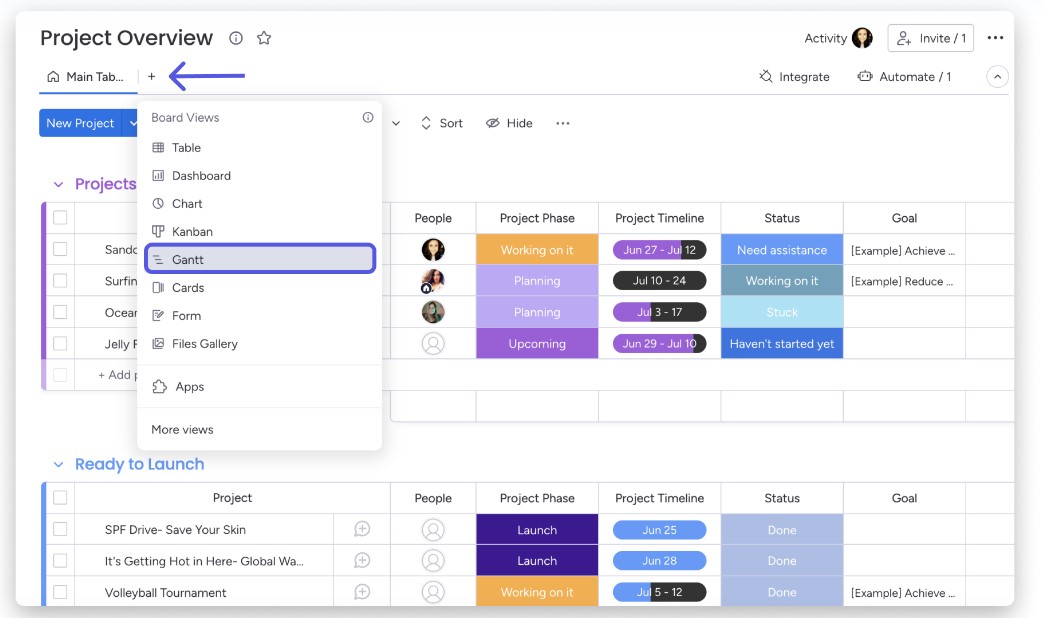
Add the Gantt View to a board
To add the Gantt View to your board, click on the “+” located at the top of your board (it will say “Add View” when you hover over it) and select “Gantt” from the dropdown menu:
By leveraging the Gantt Chart View in monday.com, you can simplify the management of complex projects, enhance your project planning and scheduling, and improve overall team collaboration and productivity.


